Impact of estimation methods of drag coefficient at sea surface on typhoon Haiyan using high-resolution air-sea-wave coupled model
>100 Views
June 08, 26
スライド概要
Wave Workshop 2019
金沢大学理工学域地球社会基盤学類 二宮研究室 学会発表などで使用した資料をアップします.
関連スライド


各ページのテキスト
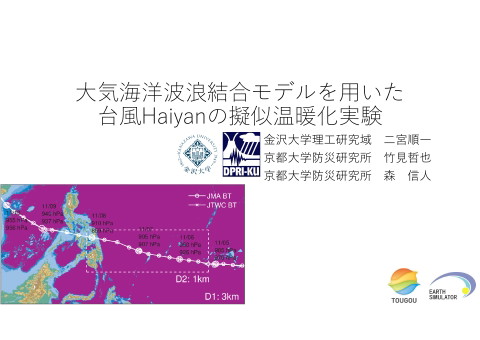
Impact of estimation methods of drag coefficient at sea surface on typhoon Haiyan using high‐ resolution air‐sea‐wave coupled model Kanazawa Univ. Kyoto Univ. Kyoto Univ. Junichi Ninomiya Nobuhito Mori Tetsuya Takemi
Motivation • To examine the sensitivity of parameterization of drag coefficient on super typhoon using high resolution modeling. Drag Coef. C D10 N /( U102 N )
Drag Coefficient (Roughness) bulk formulas • Wind dependent formula (Charnock) • . ∗ . ∗ • Wave dependent formula (Taylor and Yelland) • . . ∗ • Drag limitation • <‐>
Model Setup • Initial and boundary condition COAWST (Warner et al., 2008) • WRF Air • NCEP FNL (Spectral nudging for upper air) • 1 deg., 6 hour WRF • MGDSST (under WRF run only) • 0.25 deg., daily • ROMS • SODA v3.4.2 • 1/4 deg., 5 day • SWAN • WW3 (NOAA Reanalysis) • 1/2 deg., 3 hour • Topography • GEBCO (Ocean:‐100 ~ ‐2000) • Initial TY Bogus Sea Wave ROMS SWAN
Monthly Averaged Temperature of SODA Mean MLD MLD@2013 Mixing Layer Depth (in Nov.)
Model Setup for TC Haiyan • Period d02 • Nov. 5th, 2013 – Nov. 10th 5 days • Coupling Interval: 600 s d01 • Domain Model Resolution Horizontal Grids Vertical Grids Directions etc. Dt [s] WRF D01 3 km 1334x667 56 10 WRF D02 1 km 2002x703 56 10/3 ROMS 3 km 1334x667 40 10 SWAN 3 km 1334x667 Dir.: 24 Freq.: 24 (0.05‐0.5Hz) 300
Simulation Cases A) WRF • WRF 2 domain run using MGDSST. • Roughness (z0) is NOT limited. B) Wind w/o max z0 • Full coupled run with Charnock formula. • Roughness is NOT limited. C) Wind w/ max z0 • Full coupled run with Charnock formula. • z0<=2.85x10‐3. D) Wave • Full coupled run with Taylor‐Yelland formula (wave slope). • z0<=2.85x10‐3.
Characteristics of TY A B C D Case A, B, C, D SST [℃] Wind w/o max z0
Black: BestTrack Red: Simulation Max. Wind Speed Case A: WRF Case B: Wind w/o max z0 Case C: Wind w/ max z0 Case D: Wave
Black: BestTrack Red: Simulation Max. Storm Surge Case B: Wind w/o max z0 Case C: Wind w/ max z0 Case D: Wave
Max. Significant Wave Height Case B: Wind w/o max z0 Case C: Wind w/ max z0 Case D: Wave Black: BestTrack Red: Simulation
Wave Height around TY Case B Time: 20191106 120000 – 20191107 120000 Line: wind speed Color: wave height Blue vec.: wind dir. Red vec.: wave dir. Case B – C Case B – D
Roughness around TY Case B Case A Time: 20191106 120000 – 20191107 120000 Line: z0 (interval 0.002) Color: wind speed Blue vec.: wind dir. Red vec.: wave dir. Case C Case D
Latent Heat FluxCase around TY B Time: 20191106 120000 – 20191107 120000 Line: wind speed Color: upward latent heat flux Blue vec.: wind dir. Red vec.: wave dir. Case C Case D
Change of Water Temperature along Track Case B Difference of water temperature along TY track. 20131108 00:00 – 20131105 00:00 Black line: bottom Black circle: TY center (at 125°E) Case C Case D
Conclusions • We carried out simulations with different drag coefficient using high resolution model. • Typhoon characteristics • Full coupled run without roughness limitation had good agreement with typhoon pressure of Best Track but it overestimated wind. • Full coupled run with roughness limitation estimated weak typhoon but it had good agreement with wind speed of Best Track. • The track errors estimated every simulation were within 1 degree. • Impact of drag limitation • Typhoon intensity, latent heat flux • Impact of wave information • No significant impact on typhoon and ocean, wave response • However, this study is only a case study. The characteristics of HAIYAN have high strength and linear track. If these characteristics change, results are expected to change. (e.g. please check my ppt or text at waveworkshop 2013)